
HydroClimateSight Feature Highlight: Real-Time Soil Moisture Forecasting on Demand

At Aquanty, we're redefining how soil moisture forecasting is done in precision agriculture. Our latest innovation brings together real-time weather data, advanced hydrologic modelling, and cloud automation to deliver accurate, hyper-local soil moisture forecasts, on demand, at the click of a button. Built for farmers, consultants, researchers, and planners, this tool provides the insights needed to optimize irrigation, support crop health, and plan field operations with confidence.
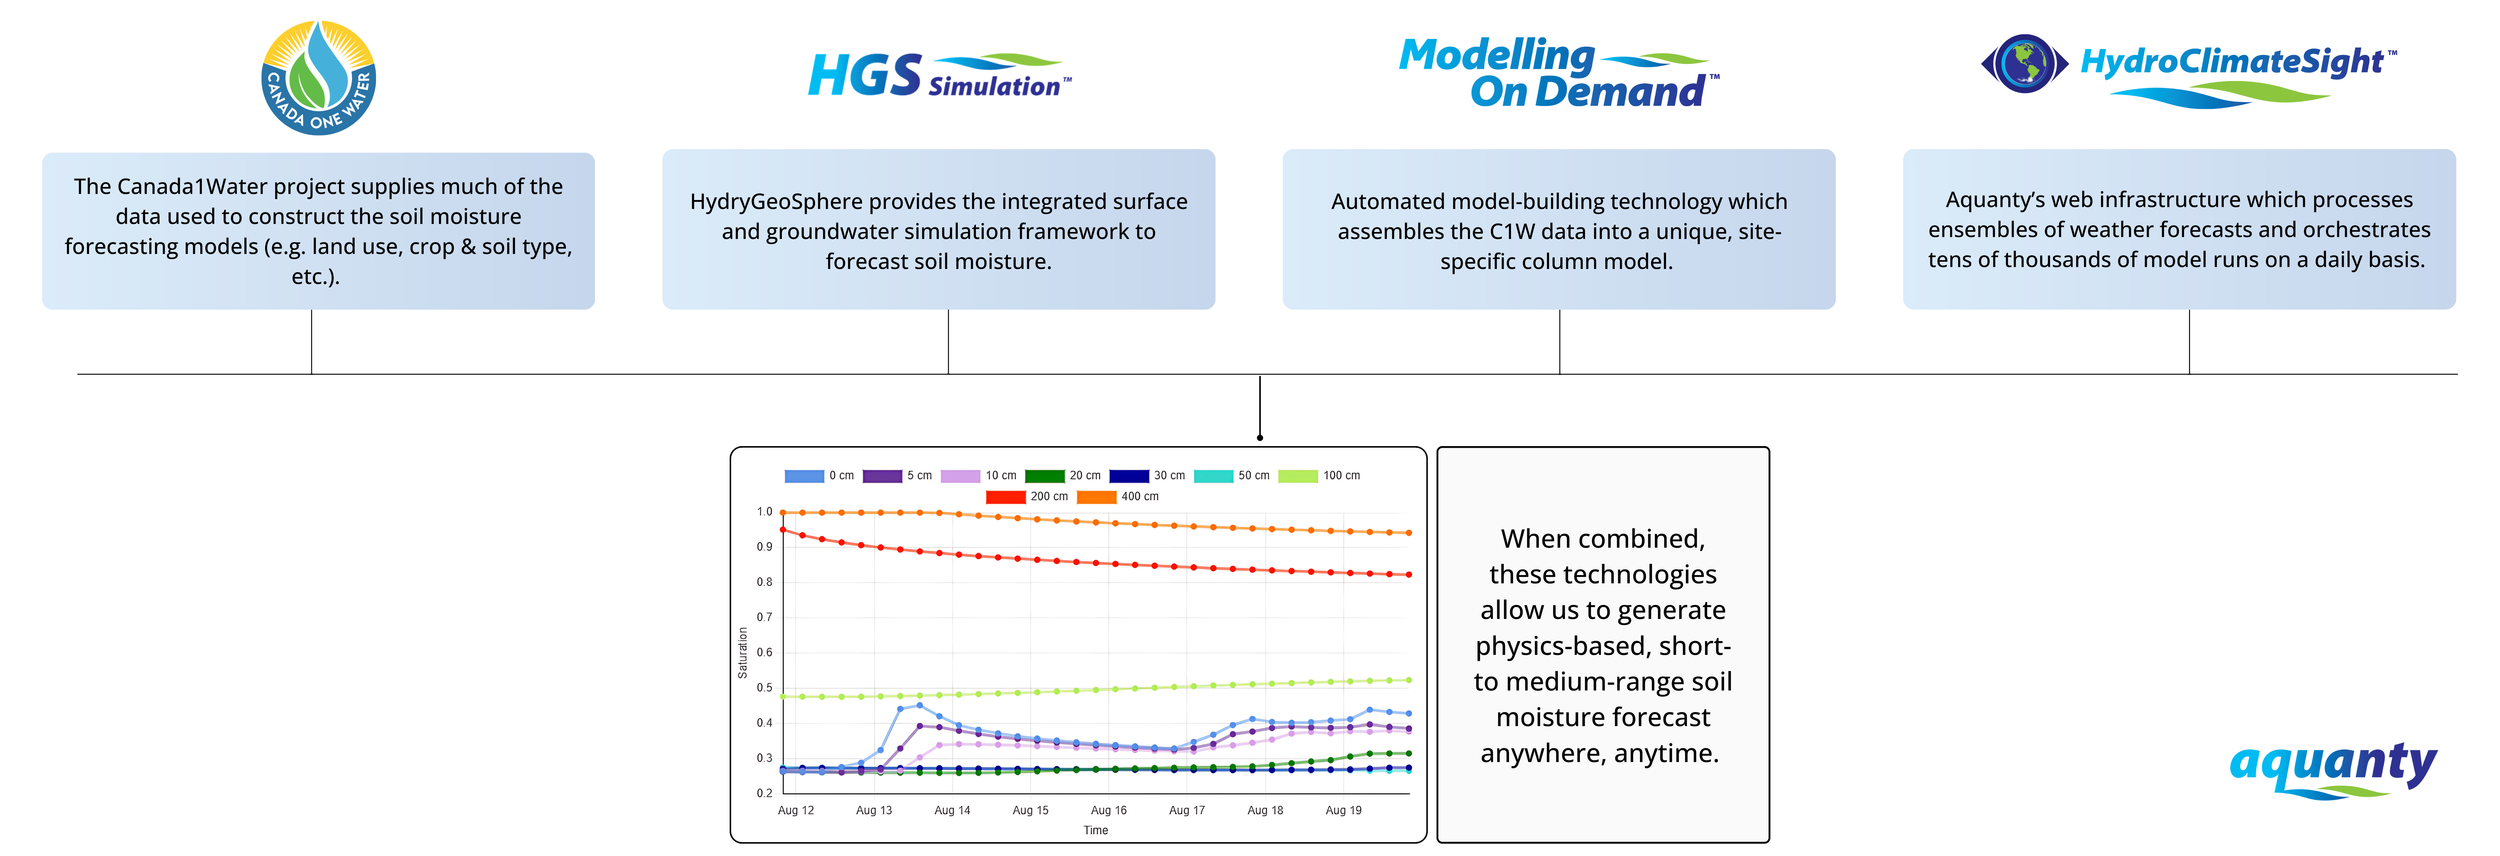
Figure 1. Behind the Technology
By harnessing the power of our flagship HydroGeoSphere (HGS) platform and leveraging scalable cloud infrastructure, we’re able to deliver high resolution vertical-scale soil moisture forecasts without the need for complex model setup or technical expertise. It provides accessible hydrological intelligence designed to scale with your needs and is adaptable to the evolving challenges of agriculture and climate resilience.
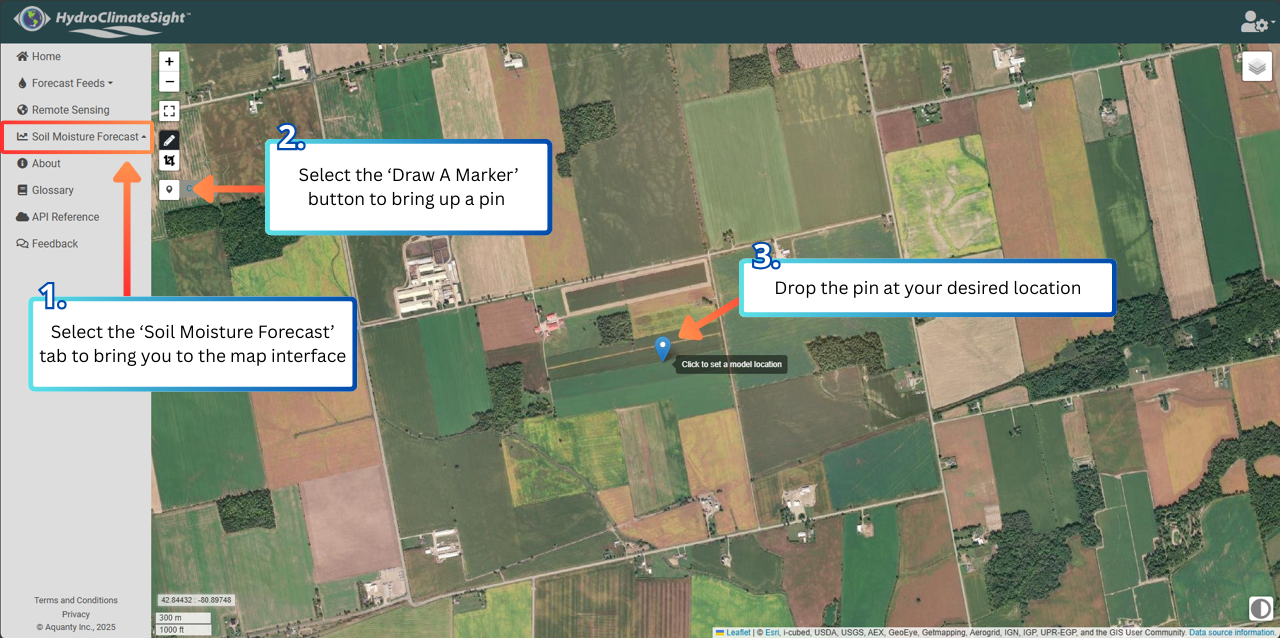
Figure 2. HydroClimateSight web interface
Behind the Technology
Our soil moisture forecasting widget brings together a wide range of Aquanty’s technological innovations. At the heart of the platform is the HydroGeoSphere (HGS) engine, a fully physics-based hydrologic model that ensures scientifically robust, transparent results. The system uses a 1-dimensional HGS column model that integrates surface flow, variably saturated groundwater flow, and evapotranspiration processes. When combined with regionally downscaled weather forecasts (through the HydroClimateSight platform) and localized land-use data extracted in part from the Canada1Water project, the result is a vertically resolved picture of soil moisture dynamics, delivered with precision at your specific point of interest (Figure 1).
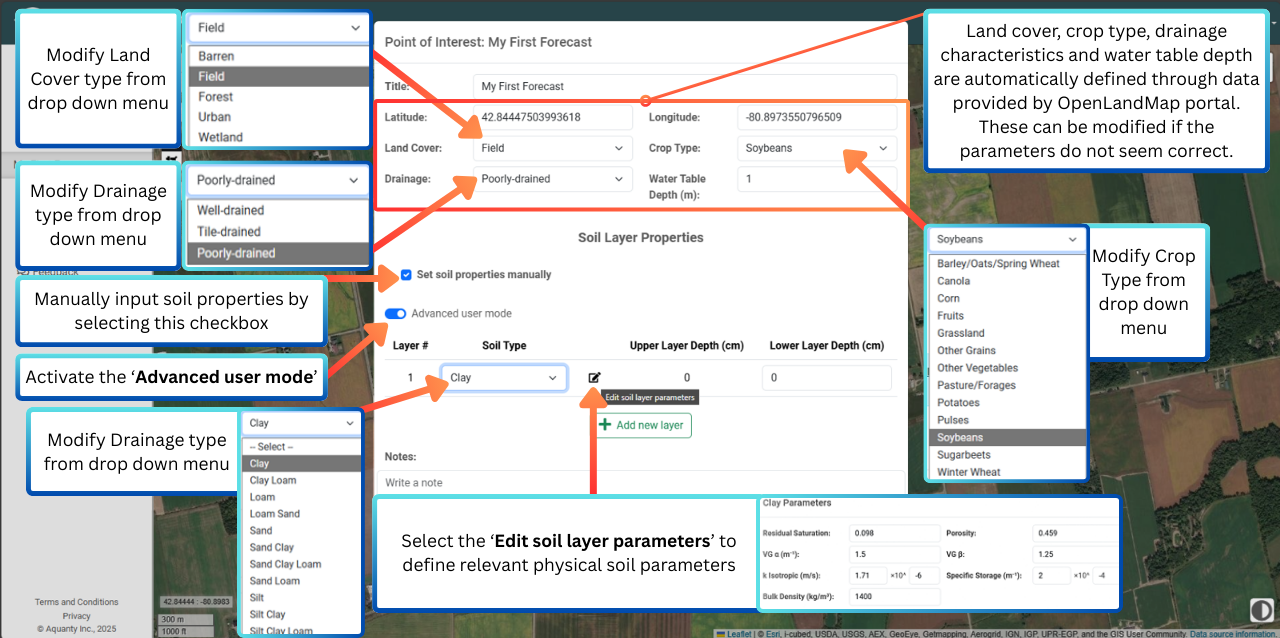
Figure 3. Exploring the station window
Forecasts are generated automatically for any selected location, using real-time weather data to produce short-term (8-day) and sub-seasonal (32-day) predictions. These outputs are calculated at 1 cm vertical resolution and reported at key standard depths (1, 5, 10, 20, 30, 50, 100, 200 and 400 cm). The platform’s cloud-based automation ensures that once a point is selected on the map, the entire workflow, from model generation to simulation, is completed in just minutes.
Our soil-moisture forecasting technology delivers hyper-localized insights, using site-specific information such as soil texture, drainage properties, and crop type to tailor each forecast. This level of detail supports better decisions in irrigation planning, crop monitoring, and agricultural research.
How It Works
On demand soil moisture forecasts are accessible via the HydroClimateSight web interface, and follows a simple, intuitive workflow (Figure 2). Below we will walk you through how to navigate the HydroClimateSight map interface to pin a location of interest and navigate the station window to build and run a soil moisture forecast:
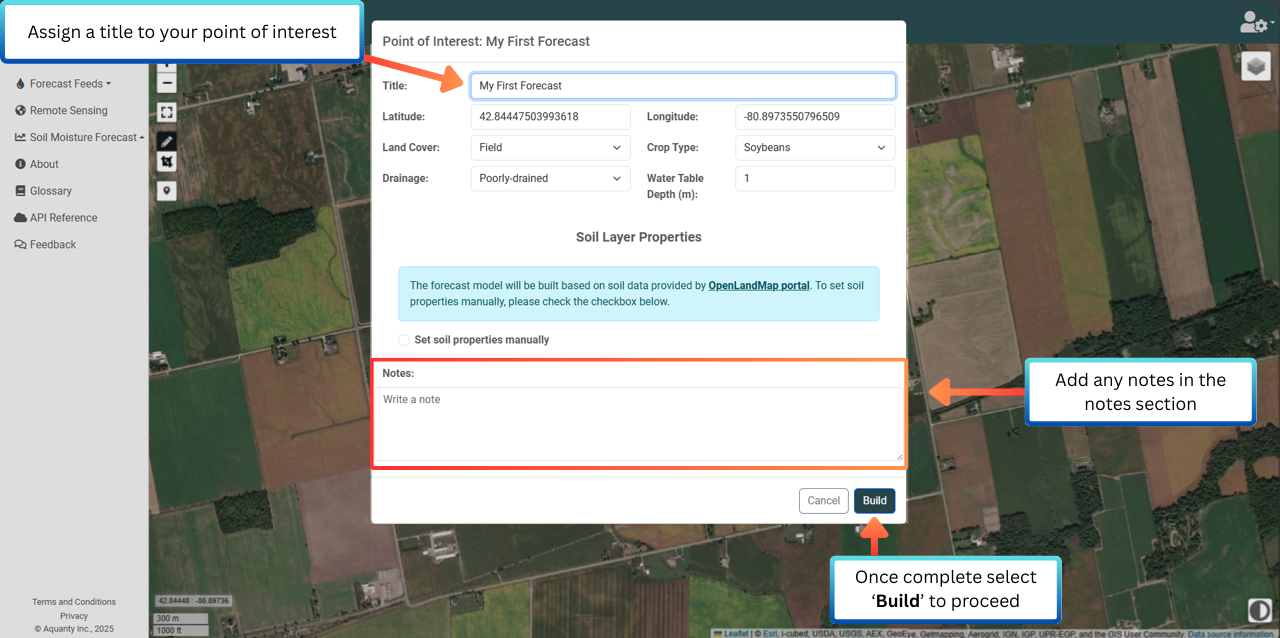
Figure 4. Auto-Build the Model
Map Interface
Select Your Location
In the HydroClimatesight platform, navigate to the ‘Soil Moisture Forecast’ tab on the left-hand menu. This will take you to the map interface. To select your farm, field, or area of interest, simply click the ‘Draw a Marker’ button on the map interface, and drop a pin at your desired location.
Station Window
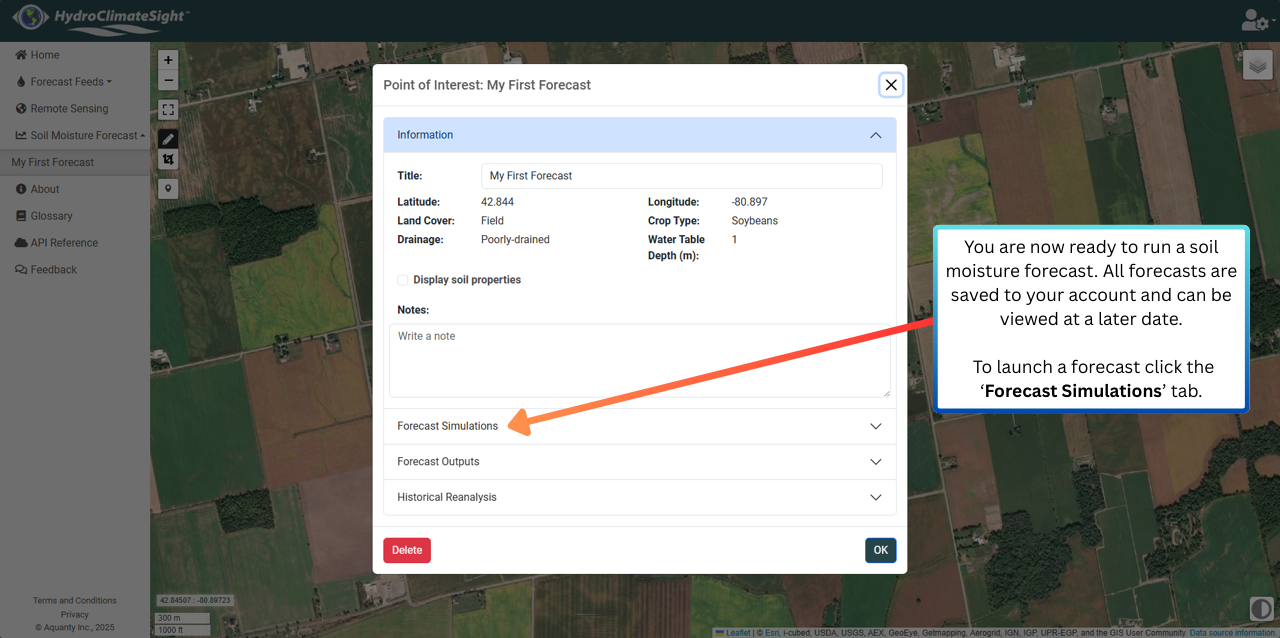
Figure 5. Set Forecast Parameters and Run a Forecast
Auto-Build the Model
Once you've dropped your point of interest, a station window will appear. Aquanty’s Modelling on Demand technology will automatically sample a series of open-government datasets to populate relevant model parameters including soil type, land-use, and crop inventory data. If the model parameters don’t seem correct you can easily modify crop type, land cover and drainage classification based on your site knowledge. For greater precision, you can also modify the structure and depth of soil layers by selecting the ‘Set Soil Properties’ checkbox and manually defining soil layer types and depths. It’s even possible to define relevant physical soil parameters (including residual saturation, porosity, hydraulic conductivity and more) directly by activating the ‘Advanced user mode’ and clicking the ‘Edit soil layer parameters’ button (Figure 3).
At this stage you can also assign a title to your point of interest and add any relevant notes. When you're ready, click ‘Build’ to instantly generate a 1D HGS column model. A notification will confirm once the model has been successfully created. You can then close the window, your point of interest will be saved within the platform and accessible at any time (Figure 4).

Figure 6. Set Forecast Parameters and Run a Forecast
Set Forecast Parameters and Run a Forecast
To run a forecast, simply click on your saved point of interest to reopen the station window. Navigate to the Forecast Simulations tab to configure your forecast settings. Choose a start date, select a forecast duration, either 8 or 32 days, and then click ‘Run Forecast’ to launch the simulation. At this point the simulation input files are updated with meteorological forcing data. The GEPS (Global Ensemble Prediction System) provides an ensemble of 21 different weather forecasts, each of which is used to launch a unique simulation. Aquanty’s HydroClimateSight web-platform automatically handles model orchestration and runs each of the 21 different hydrological simulations on the cloud (Figure 5 & Figure 6).

Figure 7. View Your Results
View Your Results
Forecast results are typically available within 5 to 10 minutes. You can monitor the progress in the Forecast Outputs tab, where a percentage indicator shows how much of the simulation has been completed, reaching 100% when finished. Once complete, select the forecast to view the results.
The output includes soil moisture values at multiple standard depths (1, 10, 25, 30, 50, and 100 cm), calculated at a 1 cm vertical resolution. Results are presented in both graphical and tabular formats and are automatically saved to your account for future access and analysis. By default results will be displayed at a specific depth, with a probability distribution indicating the range of possible soil moistures over time based on the 21 unique simulations (red line indicated median forecast, with upper/lower 90th and 10th percentiles displayed). If you click the ‘Show all depths at once’ button then the median forecasted soil moisture will be displayed at the standard depths listed above, but you can also use the ‘Percentile’ drop down menu to display the 10th/90th percentiles instead (Figure 7 & Figure 8).
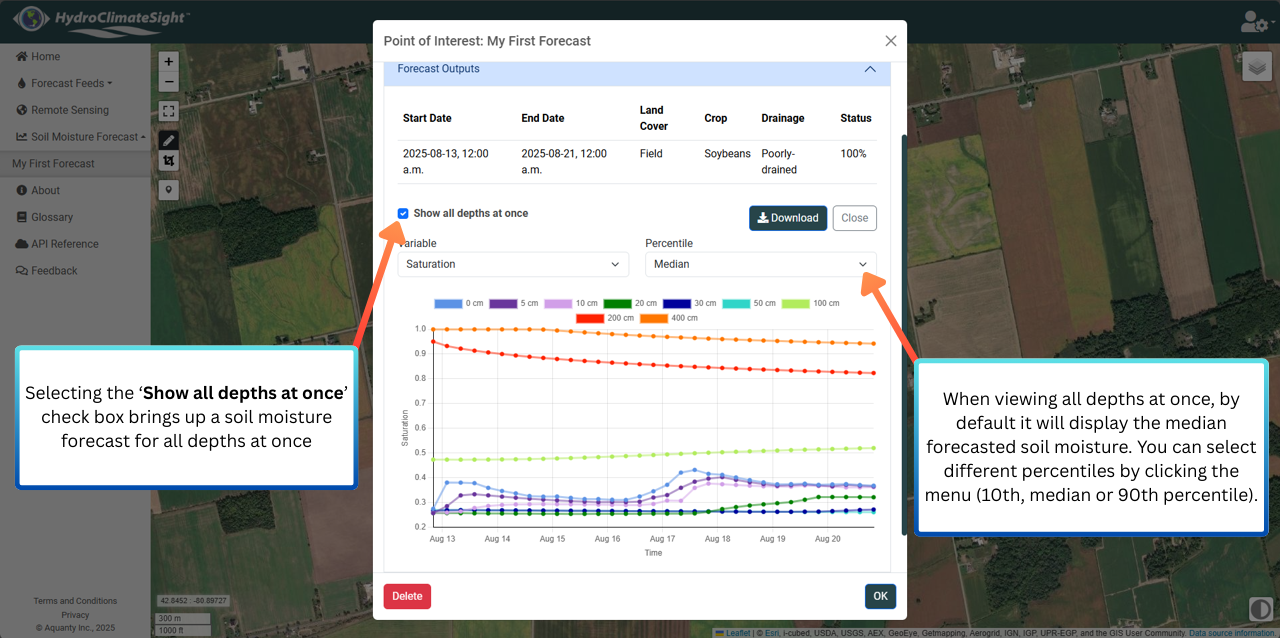
Figure 8. View Your Results
Conclusion
HydroClimateSight’s soil moisture forecasting feature represents a major step forward in accessible, science-driven agricultural forecasting. By combining the power of physics-based modelling with cloud automation and real-time meteorological data acquisition and processing, we’re making high-resolution soil moisture intelligence available to anyone. Whether you're optimizing irrigation, preparing for a dry spell, or conducting research , HydroClimateSight empowers you to make informed, data-backed decisions with confidence. As we continue to expand and scale the platform, the future of precision agriculture is becoming more accessible and impactful every day.
Get in Touch
Interested in seeing the soil moisture forecasting technology in action? Contact us today at info@aquanty.com to schedule a demo or learn more about how this technology can support your work.