
HydroClimateSight Feature Highlight: Unlock Powerful Insights with HydroClimateSight’s Remote Sensing Map Layers

Modern water and land resource management relies on timely, reliable, and spatially detailed data. Aquanty’s HydroClimateSight platform empowers decision-makers by integrating a diverse set of authoritative datasets into a range of physics-based and machine-learning based hydrologic models. HydroClimateSight provides direct access to many of these datasets through the Remote Sending tab to help users better understand the datasets that go into these models. Let’s review some of the available data layers that give HCS users visual and analytical insights sourced from globally recognized organizations, government agencies, and open-data initiatives.
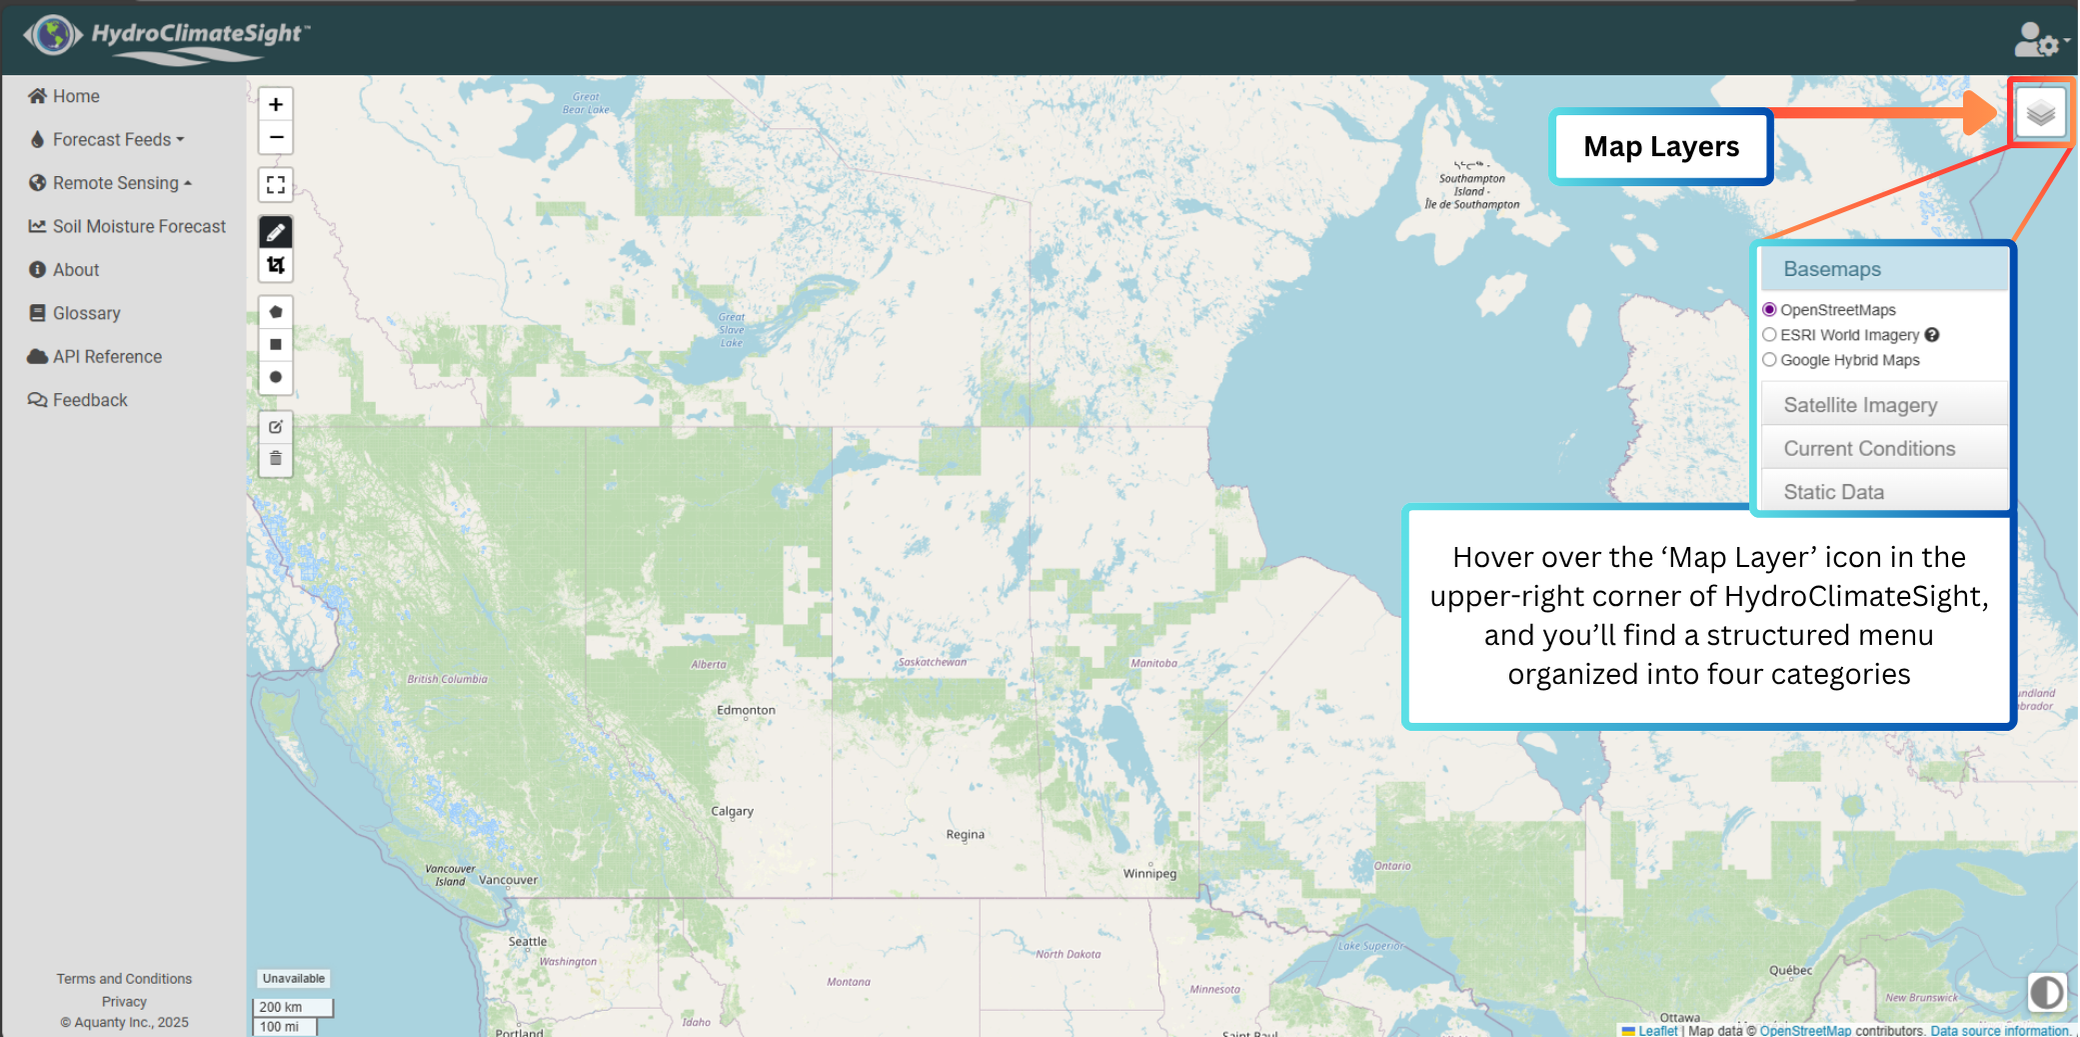
Figure 1. Accessing Map Layers on HydroClimateSight.
Accessing Map Layers
Hover over the Map Layers icon in the upper-right corner of HydroClimateSight, and you’ll find a structured menu organized into four categories: (See Figure 1)
Basemaps
Satellite Imagery
Current Conditions
Static Data
Data Layers
Each category includes layers from some of the most trusted geospatial and environmental data providers in the world. Below, we explore these layers and their sources in detail.
1. Basemaps
Basemaps create the spatial backdrop upon which all other layers are displayed. They ensure that users can easily navigate to their area of interest and provide context for interpreting data overlays.
OpenStreetMap (OSM)
Source: OpenStreetMap Contributors
OSM is a global collaborative project creating a free, editable map of the world. It is widely used in research, disaster response, and navigation.
OSM provides accurate roads, cities, and landmarks, making it a reliable reference layer for identifying precise locations.
ESRI World Imagery
Source: ESRI World Imagery Service
ESRI (Environmental Systems Research Institute) is a leader in GIS technology. Their World Imagery layer aggregates high-resolution satellite and aerial imagery, often updated every few years.
This layer enables detailed identification of land parcels, natural features, and field boundaries.
Google Hybrid Maps
Source: Google Maps Platform
Google Maps is one of the most widely used mapping services globally. Its hybrid view combines satellite imagery with map labels (roads, place names).
This hybrid approach is useful for precision navigation and planning, as it provides both imagery detail and clear labeling.
2. Satellite Imagery
Satellite imagery layers deliver up-to-date views of Earth’s surface, enabling users to monitor vegetation, water bodies, and snow cover on a daily basis. These layers provide essential context for weather, climate, and agricultural assessments.
MODIS Terra True Color
Source: NASA GIBS / MODIS
NASA’s MODIS (Moderate Resolution Imaging Spectroradiometer) instrument is aboard the Terra satellite and provides near-global coverage with a daily refresh.
MODIS True Color imagery helps users assess large-scale conditions like cloud cover, vegetation greenness, and snow cover. Its broad coverage and daily updates make it essential for regional monitoring.
3. Current Conditions: Near Real-Time Environmental Layers
These layers deliver up-to-date measurements for operational decision-making, sourced from authoritative agencies.
SnoDAS (Snow Water Equivalent)
Source: NSIDC SnoDAS Dataset
The National Snow and Ice Data Center (NSIDC) at the University of Colorado Boulder curates global cryosphere data. SnoDAS combines ground observations, satellite data, and modelling to estimate snow water equivalent (SWE).
SWE is a critical parameter for flood forecasting, water supply planning, and climate studies.
24-Hour Accumulated Precipitation
Source: ECCC HRDPA Dataset
Environment and Climate Change Canada (ECCC) provides high-resolution deterministic precipitation analyses through the HRDPA (High Resolution Deterministic Precipitation Analysis) product.
Understanding precipitation totals over the past day is vital for hydrologic modelling, flood risk assessment, and agriculture.
Weather Radar Precipitation
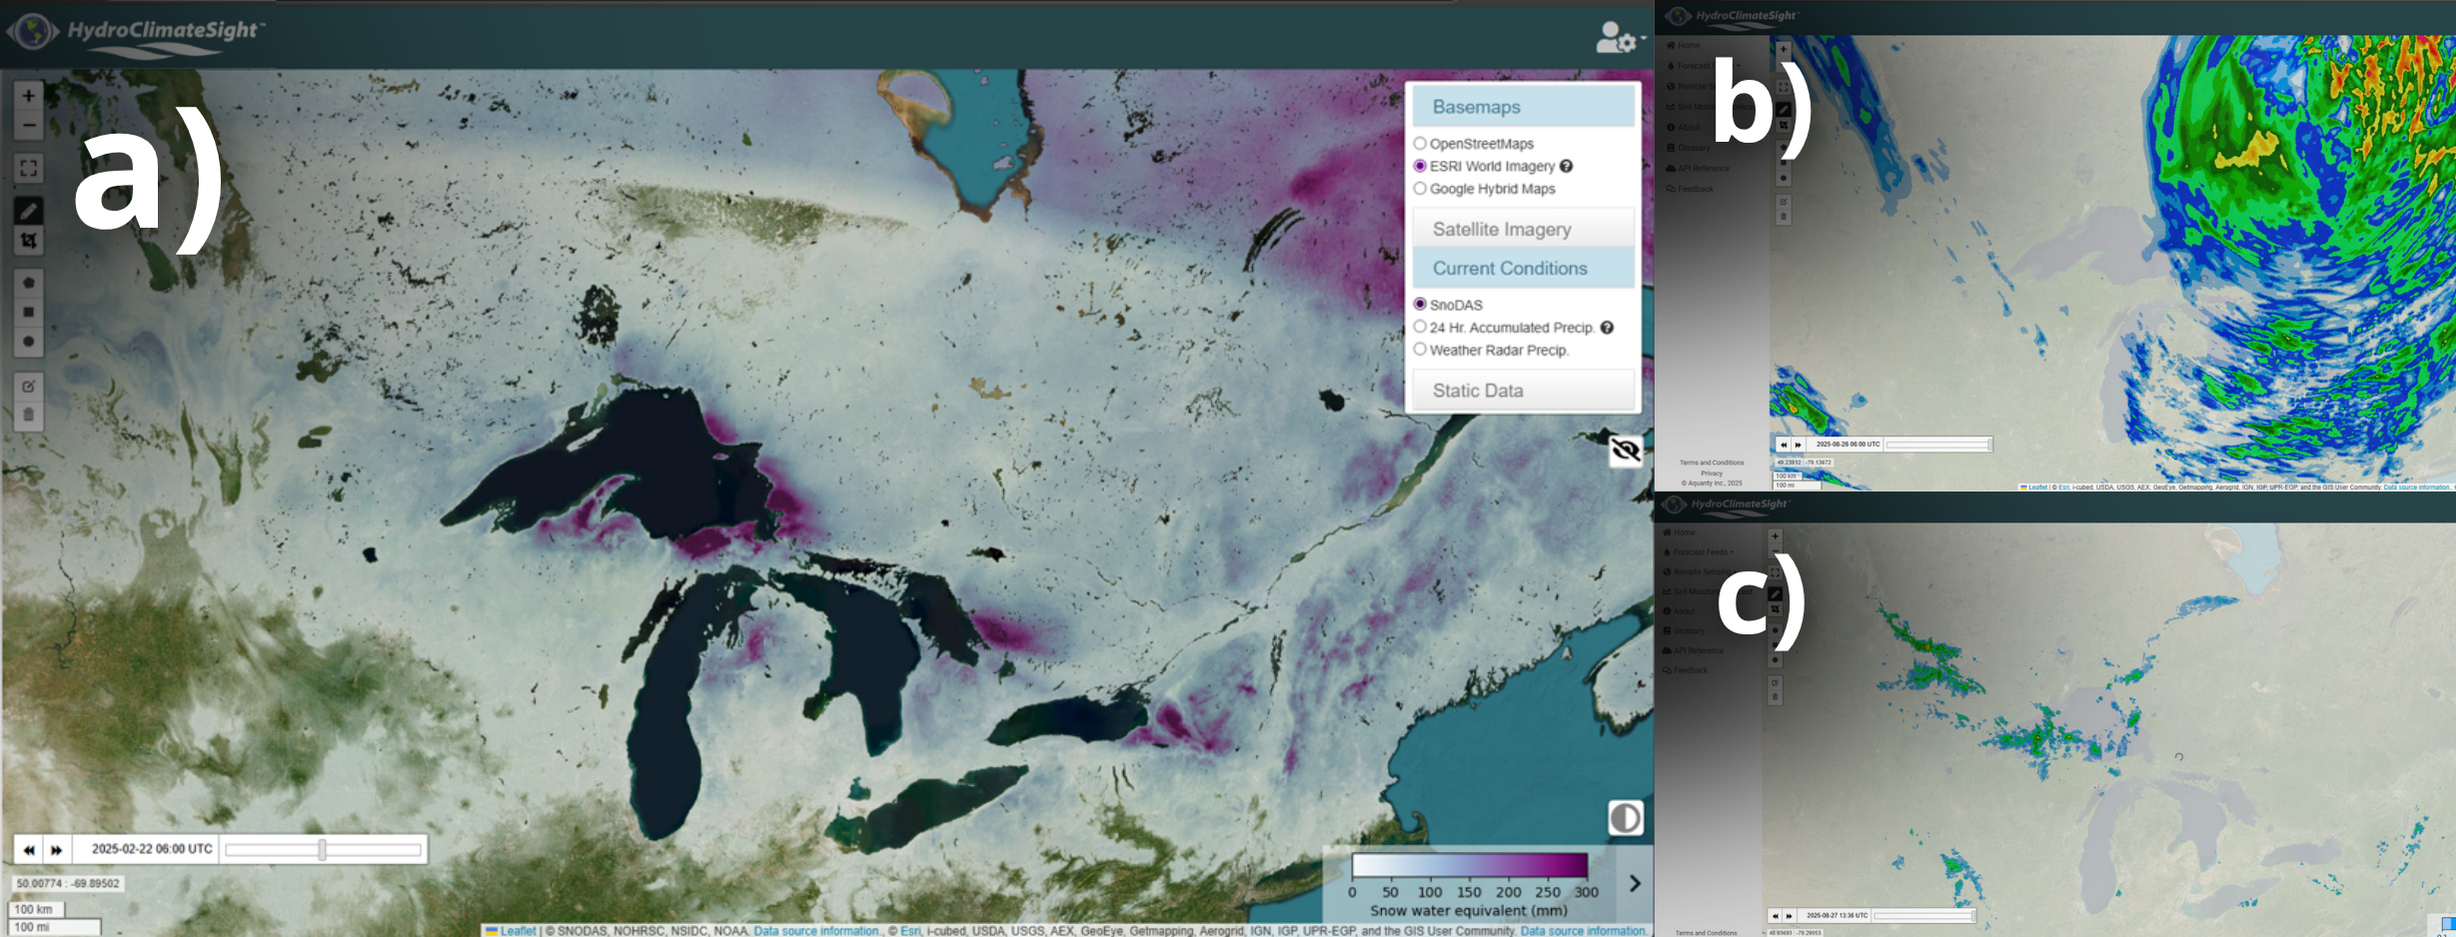
Figure 2. a) SnoDAS, b) 24-hour Accumulated Precipitation, and c) Weather Radar Precipitation.
Source: ECCC Radar Geomet Data
Radar-based precipitation estimates from ECCC’s national radar network provide near real-time data at 10-minute intervals.
This granular temporal resolution supports applications like short-term forecasting, flood warnings, and storm tracking.
(See Figure 2)
4. Static Data
These datasets don’t update daily but form the backbone for environmental and agricultural planning:
Canadian Land Inventory (CLI)
Source: AAFC CLI Database
Managed by Agriculture and Agri-Food Canada, the CLI provides a classification system for land capability for agriculture.
It helps determine land suitability for mechanized farming and identifies soil limitations.
CLI data is regularly incorporated into the HydroGeoSphere models which power Aquanty’s physics-based hydrologic forecasting system – HGSRT.
Note: You can hover over a location on the map to bring up land cover information
Annual Crop Inventory (ACI)

Figure 3. a) Canadian Land Inventory, b) Annual Crop Inventory, c) Canadian Detailed Soil Surveys, and d) Provincial Digital Elevation Model.
Source: AAFC Crop Mapping Program
Based on optical and radar satellite imagery, this dataset maps crop types across Canada with an 85% accuracy target.
Useful for monitoring agricultural trends, market planning, and research into land-use change.
ACI data is regularly incorporated into the HydroGeoSphere models which power Aquanty’s physics-based hydrologic forecasting system – HGSRT.
Note: You can hover over a location on the map to bring up crop type information
Canadian Detailed Soil Surveys (CDSS)
Source: HydroClimateSight Remote Sensing
Aggregated from regional soil survey databases maintained by AAFC and provincial agencies.
Provides detailed soil texture, drainage, and classification data essential for hydrologic modeling and agronomic decision-making.
CDSS data is regularly incorporated into the HydroGeoSphere models which power Aquanty’s physics-based hydrologic forecasting system – HGSRT.
Note: You can hover over a location on the map to bring up detailed soil survey data
Global Soil Organic Carbon (GSOC)
Source: ISRIC SoilGrids Database
Developed by ISRIC (International Soil Reference and Information Centre), this dataset estimates global soil organic carbon stocks.
Key for carbon sequestration studies, soil health assessment, and climate mitigation strategies.
Shaded Relief
Source: Government of Canada Open Data
Produced from digital elevation data, this layer visualizes topographic variation across Canada.
Helps users interpret terrain and identify elevation-related constraints for infrastructure or hydrology.
Provincial Digital Elevation Model (DEM)
Sources:
DEM data from provincial governments and federal repositories provide high-resolution elevation grids.
Essential for watershed delineation, floodplain modelling, and infrastructure design.
(See Figure 3)
Final Thoughts
HydroClimateSight doesn’t just present data, it ensures that every layer originates from trusted scientific and government agencies, including NASA, NSIDC, AAFC, ECCC, ISRIC, and provincial authorities. These organizations adhere to rigorous quality-control standards, making the data suitable for operational decision-making, research, and policy development. By integrating these layers, HydroClimateSight transforms complex datasets into actionable insights, enabling everything from short-term flood forecasting to long-term climate resilience planning.
Ready to explore these powerful capabilities? Contact Aquanty today at info@aquanty.com for a demo and see how Remote Sensing Map Layers can elevate your decision-making.