
HGS RESEARCH HIGHLIGHT – Sources of surface water in space and time: Identification of delivery processes and geographical sources with hydraulic mixing-cell modeling
Glaser, B., Hopp, L., Partington, D., Brunner, P., Therrien, R., & Klaus, J. (2021). Sources of Surface Water in Space and Time: Identification of Delivery Processes and Geographical Sources With Hydraulic Mixing‐Cell Modeling. In Water Resources Research (Vol. 57, Issue 12). American Geophysical Union (AGU). https://doi.org/10.1029/2021wr030332
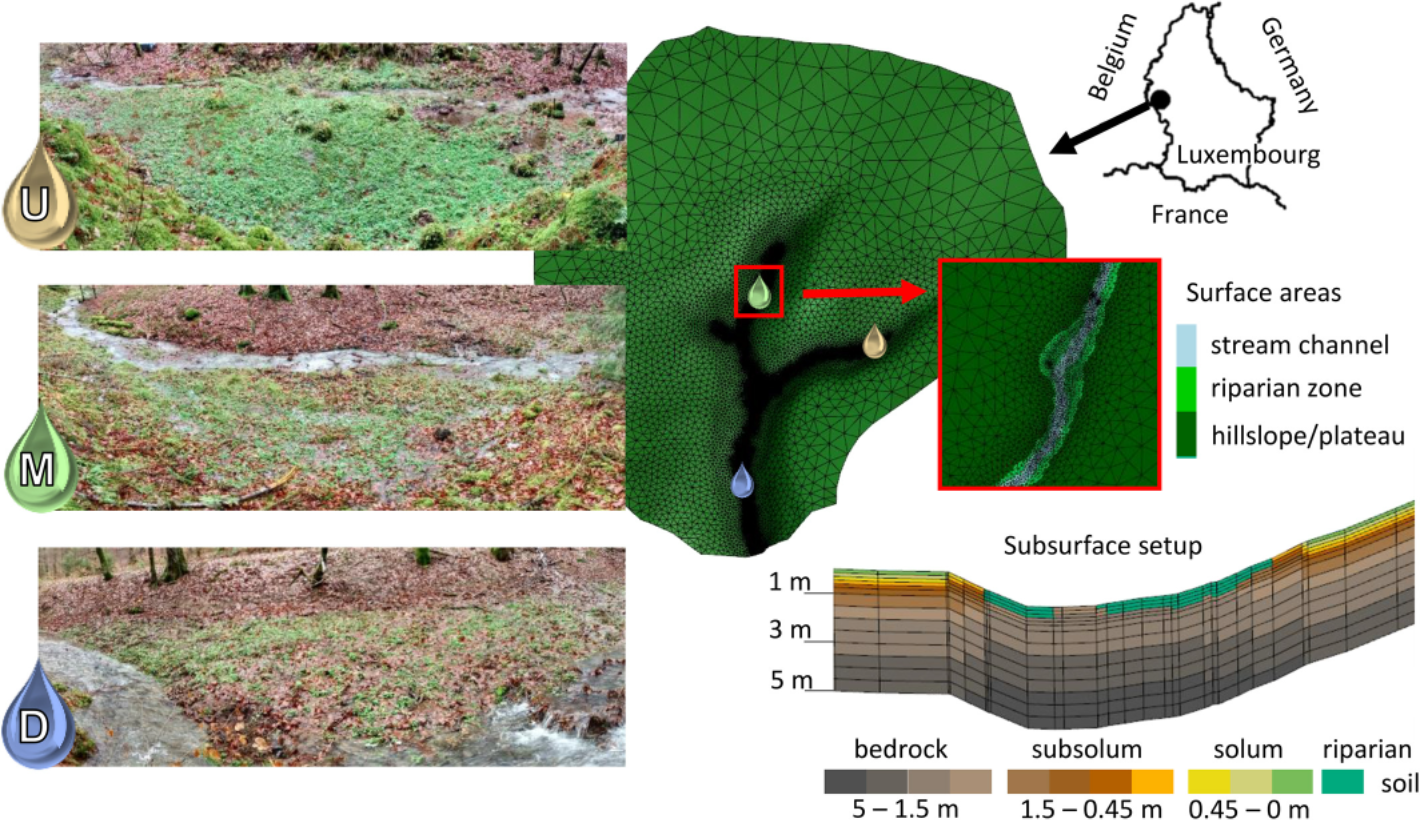
Figure 1. Model setup of the 42 ha Weierbach catchment in western Luxembourg. The three riparian-stream areas investigated in this study are located at an upstream section at the eastern tributary (U, 155 m2), a midstream section at the middle tributary (M, 169 m2), and a downstream section at the main stream (D, 170 m2). The nested model mesh is colored according to the delineation of the surface domain into hillslopes and plateau, riparian zone, and stream channel. The profile at the bottom right shows the vertical discretization of the subsurface model domain and the assigned parameterization zones in and adjacent to the riparian zone, corresponding to the fresh and fractured bedrock (slate and phyllites), the subsolum (regolithic saprock), the solum of the hillslopes and plateau (Cambisol), and the riparian soil (Leptosol) of the catchment.
This paper presents a very interesting post-processing method for HydroGeoSphere models. The study is based on a highly validated model of the Weierbach catchment, a 42 hectare forested catchment in western Luxembourg with three small tributaries flowing into the main stream branch.
The results of the HydroGeoSphere model were used as input into the “hydraulic mixing-cell (HMC) approach[,] a modified mixing-cell approach developed for integrated surface-subsurface hydrologic models [which] enables tracking and delineation of the mixing of predefined initial water sources at any location and at any time based on information from the hydraulic flow solution.” Using the HMC method the authors are able to produce a more detailed accounting of the ultimate sources of water contributing to streamflow at 36 distinct points of interest throughout the model domain.
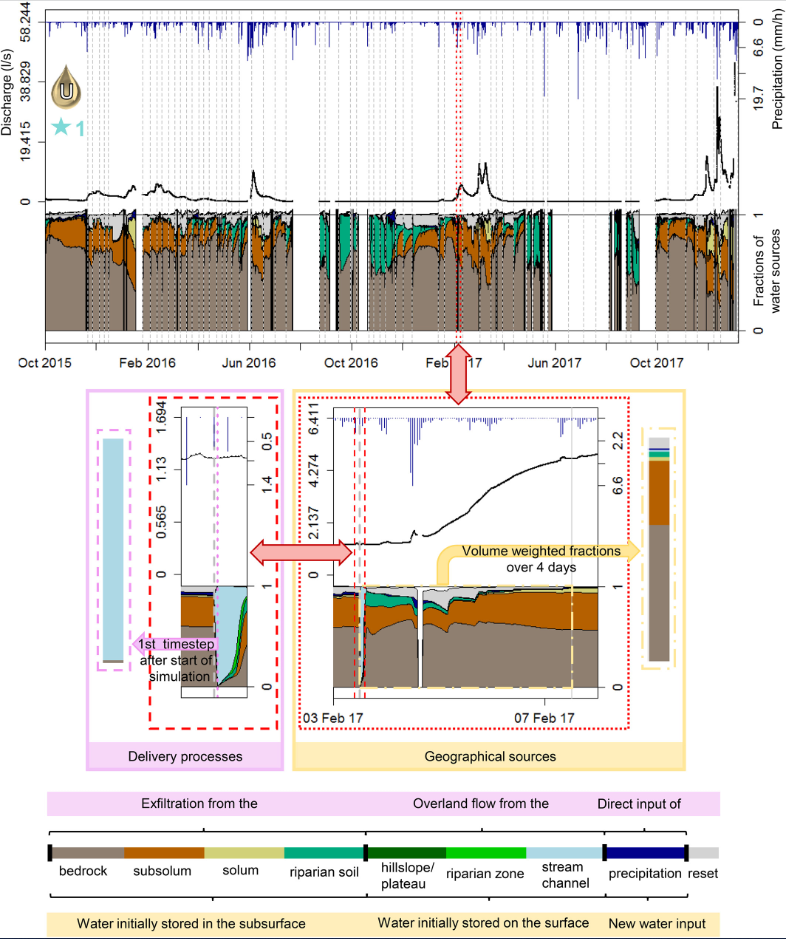
Figure 3. Output and processing of the HMC simulation exemplified for POI 1 located in the stream channel of area U (cf. Figure 2). Time series of hourly precipitation and simulated discharge at the POI are shown at the top of each figure panel. Stacked time series for fractions of water originating from the seven different initial source areas defined in the surface and subsurface model domains (cf. Figure 1), fractions of precipitation, and reset fractions visualize the dynamic mixing of water sources (bottom of each figure panel). Gaps in the time series of fractions of water sources indicate that the POI was inactive (simulated discharge is zero) or that the time points were excluded from the analysis due to high mass balance errors (no simulated discharge shown). Gray dotted lines show the start of the 64 simulation sub-periods where water sources were re-initialized according to the seven different source areas.
“The information obtained from the HMC simulation goes beyond standard model output and was very valuable for identifying and comparing the contributions of various sources of surface water at different locations,” both clarifying and enhancing the authors understanding of the Weirbach study site. This approach helped to confirm the importance of subsurface contributions to streamflow, revealed the different contribution offered by different subsurface sources, and highlighted the spatial and temporal variability (or lack thereof) of streamflow contributions from different geographical sources and via different flow processes.
CLICK HERE TO READ THE ARTICLE.
Abstract:
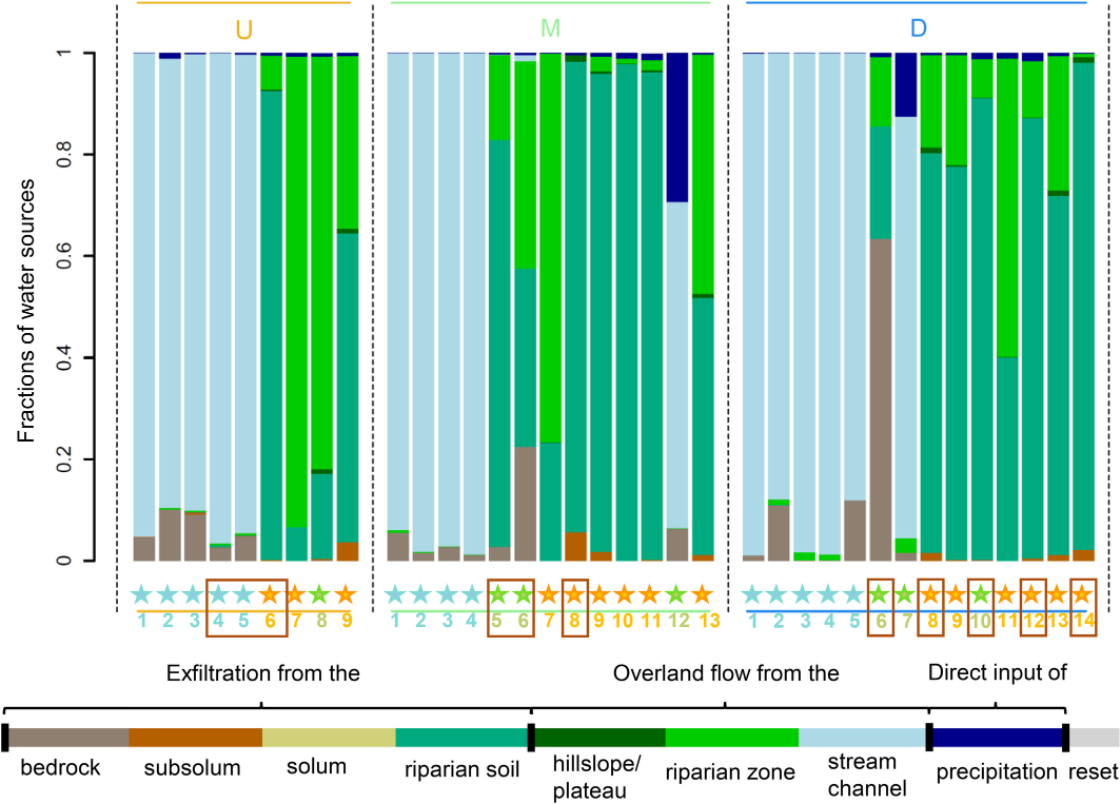
Figure 5. Spatial variability of delivery processes. The bars visualize the mixing ratio of different sources of surface water at the 36 POIs located in the stream channel (blue stars), in the riparian zone (yellow stars), and at unclassifiable positions (green stars) in areas U, M, and D (cf. Figure 2). The POIs enclosed in brown boxes are at locations with assumed distinct exfiltration of subsurface water (cf. Figure 2). The fractions of water sources are the arithmetic mean of the fractions of water sources after the first time step of each of the 64 sub-period simulations (cf. Figure 3).
Knowledge of the sources of surface water in riparian zones and floodplains is critical to understanding its role in runoff generation and impact on biogeochemical and ecological processes. In this study, we demonstrate the potential of integrated surface-subsurface hydrologic modeling (HydroGeoSphere) in combination with a hydraulic mixing-cell approach to decipher different sources of surface water and their mixing in space and time. We present a novel approach to processing the model data that allowed us to compare which mechanisms ultimately transferred water to the surface (delivery processes) and from where the surface water originated (geographical sources) for varying wetness states and phases of wetting or drying across 36 test locations within the riparian-stream continuum of an intensively-studied, humid-temperate, forested headwater catchment (45 ha). Consistent with current process understanding for the study site, water exfiltrating from the subsurface was simulated as the dominant source for riparian surface water and intermittent streamflow. The model further helped to specify the relevance of different subsurface stores, revealing a wetness-dependent activation of upslope source areas. Contributions of riparian overland flow and precipitation were minor during all investigated phases of wetting and drying. Moreover, the spatial variability of surface water sources proved to be smaller than expected for the heterogeneous patterns and frequencies of the surface saturation observed and simulated. Based on these findings, we discuss the value of hydraulic mixing-cell modeling to complement the planning and interpretation of field investigations and to enhance process understanding regarding the spatio-temporal sources of surface water.