
HGS RESEARCH HIGHLIGHT – Testing high resolution numerical models for analysis of contaminant storage and release from low permeability zones

Chapman, S. W., Parker, B. L., Sale, T. C., & Doner, L. A. (2012). Testing high resolution numerical models for analysis of contaminant storage and release from low permeability zones. In Journal of Contaminant Hydrology (Vols. 136–137, pp. 106–116). Elsevier BV. https://doi.org/10.1016/j.jconhyd.2012.04.006
“HydroGeoSphere was selected as the base case for comparison to the other codes, given it has been rigorously tested for advection and diffusion transport scenarios against analytical solutions and field data”
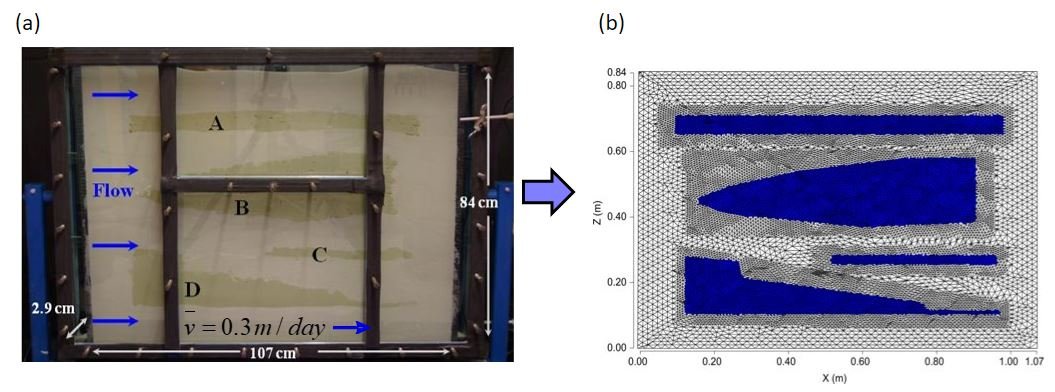
Figure 1: (a) Sand tank for dual tracer study showing bentonite zones surrounded by lighter sand; and (b) assumed geometry of clay layers and grid discretization applied in HydroGeoSphere, with approximately 25,000 discrete elements.

Figure 2: (a) Photos showing visual fluorescein distribution during the 22-day loading phase at days 5 and 15, and during the subsequent flushing phase at days 27 and 74 (5 and 52 days after termination of source input); and (b) simulated HydroGeoSphere contours at similar times as the experimental photos. Note that the simulated contours are plotted to C/Co=1e-3, which is below visual observation limits.
This study by researchers at the University of Guelph and Colorado State University tests out different numerical groundwater flow and transport models to simulate contamination diffusing into and subsequently out of low permeability zones. It can be difficult to model such events due to the scale of the problem and high resolution needed to accurately capture the inward and outward diffusion gradients. A sand tank experiment was conducted to evaluate matrix diffusion processes by injecting two tracers, fluorescein and bromide, into a sand tank containing discrete low permeability layers (Figure 1a). The tracers were injected for a 22-day period (loading phase), followed by flushing with clean water for an additional 100 days to examine back diffusion (flushing phase). Besides allowing for visualization of diffusion / back diffusion processes with the fluorescein tracer (Figure 2a), both fluorescein and bromide were also quantified in the tank effluent (Figure 3) to allow quantification of these processes.
This paper looks specifically at applying three high-resolution numerical models, HydroGeoSphere, FEFLOW and MODFLOW, to evaluate whether these models, when adequately discretized, can accurately reproduce the experimental results. This is critical at contaminated sites, where much attention has been placed on release of contamination from low permeability zone, which can sustain plumes for long time-periods even after the primary source is exhausted (for example, see SERDP Project ER-1740). This makes it even more important to be able to accurately simulate these processes, and this is particularly true with chlorinated solvents where concentrations of concern (i.e., MCLs) can be orders-of-magnitude lower than initial release concentrations (i.e., up to solubility levels). There were a few steps to ensure that the models were accurate:
incorporate the primary governing processes,
solve the equations accurately,
minimize numerical dispersion, and
determine the appropriate input parameters and discretization scales to capture the geometry and processes.
This paper confirmed that all three of the software models tested can replicate the experimental results when they are sufficiently discretized (e.g., see Figure 1b for discretization applied in the HydroGeoSphere model). A good comparison was obtained between the visual experimental results and simulated contours using HydroGeoSphere (Figure 2) as well as replicating the tailing behavior in effluent concentrations over a nearly 4 order-of-magnitude range (Figure 3). The models were further tested in their ability to simulate a larger field-scale problem of an aquifer with underlying aquitard against an analytical solution (Sale et al., 2008) and again the models were shown able to adequately reproduce the analytical solution results (see Supporting Information in Chapman et al., 2012 and Sale et al., 2013), showing potential to be expanded to more complex field scenarios.
There has been much research in this field in the past and this study builds on that. Additionally, it incorporates complex numerical models to test their efficiency. This information is important as downstream water quality is affected by the release of contaminants and if plume tailing can be predicted beforehand, that could protect water sources and help better manage sites contaminated with chlorinated substances and other contaminant types. Concentration gradients are the drivers of immobile contaminants in low permeability zones and diffusion processes push the effective or secondary “source” further downstream to include low permeability zones with stored contamination. This research focused specifically on situations with stratified layers of sandy aquifers with low permeability zones, whereas the tailing effects can be even more accentuated in fractured bedrock environments.

Figure 3: Graph comparing experimental and simulated bromide and fluorescein tracer arrival and elution curves at the effluent end using HydroGeoSphere (normalized to average input concentrations).
Abstract:
It is now widely recognized that contaminant release from low permeability zones can sustain plumes long after primary sources are depleted, particularly for chlorinated solvents where regulatory limits are orders of magnitude below source concentrations. This has led to efforts to appropriately characterize sites and apply models for prediction incorporating these effects. A primary challenge is that diffusion processes are controlled by small-scale concentration gradients and capturing mass distribution in low permeability zones requires much higher resolution than commonly practiced. This paper explores validity of using numerical models (HydroGeoSphere, FEFLOW, MODFLOW/MT3DMS) in high resolution mode to simulate scenarios involving diffusion into and out of low permeability zones: 1) a laboratory tank study involving a continuous sand body with suspended clay layers which was ‘loaded’ with bromide and fluorescein (for visualization)tracers followed by clean water flushing, and 2) the two-layer analytical solution of Sale et al. (2008)involving a relatively simple scenario with an aquifer and underlying low permeability layer. All three models are shown to provide close agreement when adequate spatial and temporal discretization are applied to represent problem geometry, resolve flow fields and capture advective transport in the sands and diffusive transfer with low permeability layers and minimize numerical dispersion. The challenge for application at field sites then becomes appropriate site characterization to inform the models, capturing the style of the low permeability zone geometry and incorporating reasonable hydrogeologic parameters and estimates of source history, for scenario testing and more accurate prediction of plume response, leading to better site decision making.